

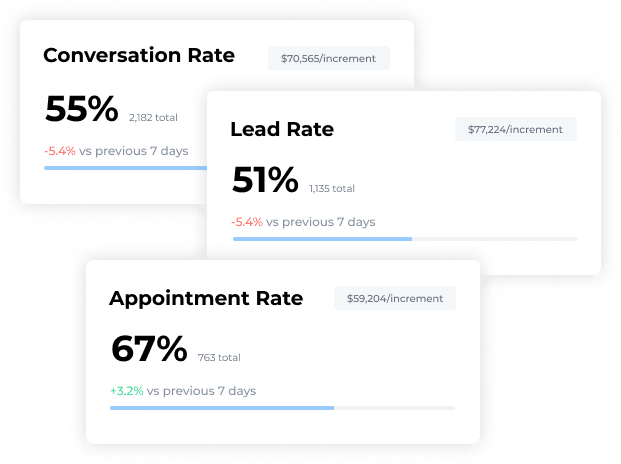
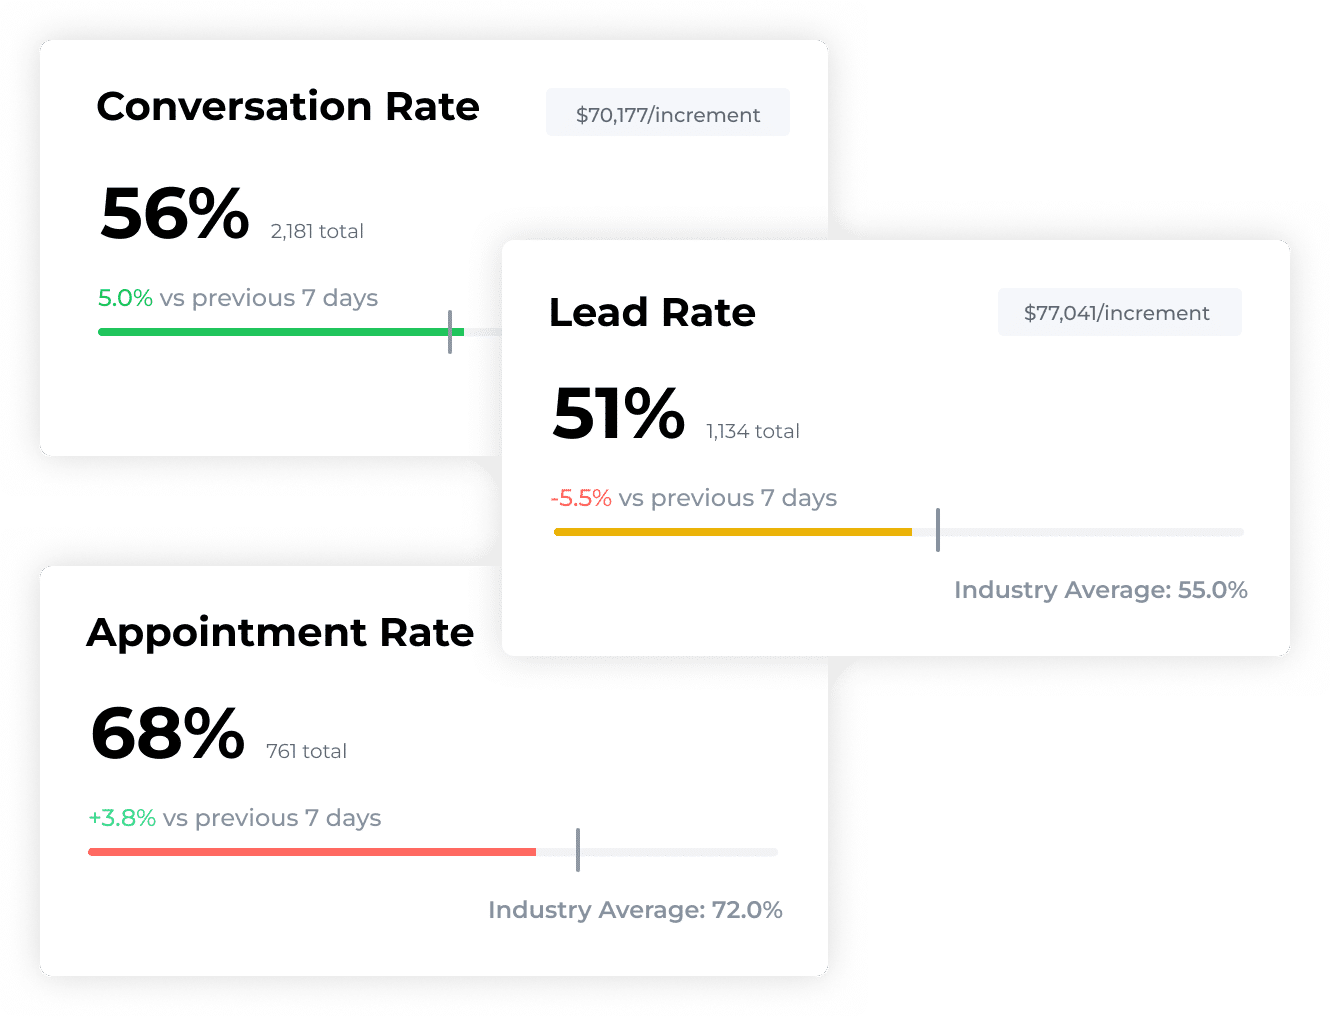
KPI Performance Dashboard
Gives teams a clear snapshot of core KPIs so they can quickly identify where performance is strong, where it is breaking down, and which areas need attention first.
Book a Demo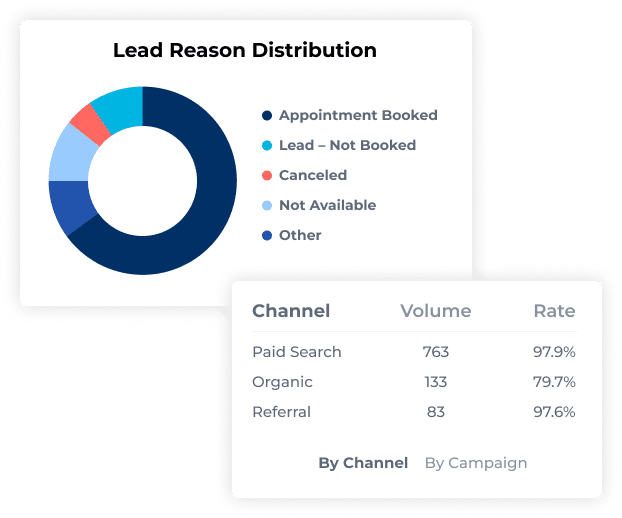
Configurable Data Analytics
New Data Grid and Data Explorer views enable users to evaluate performance by any dimension of their business, configure dashboards and reports, and share personalized views across the organization.
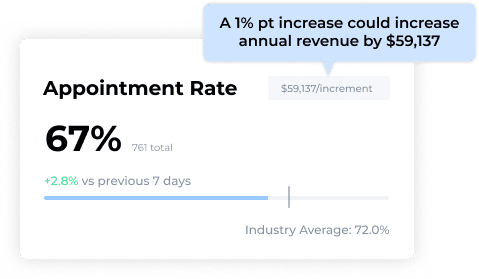
Projected Revenue Impact
Translate KPI increases into estimated annual revenue impact, helping teams prioritize the changes most likely to drive measurable revenue growth.
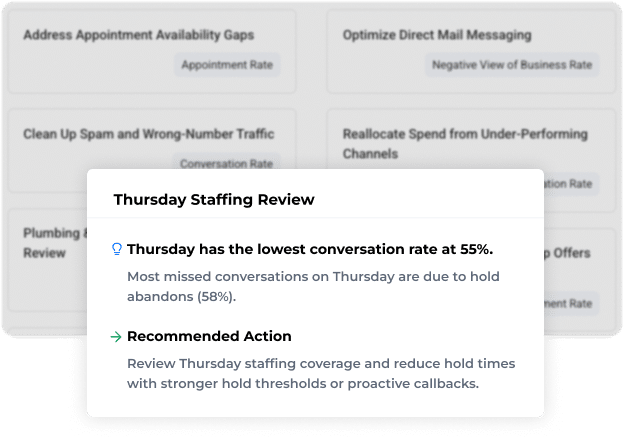
Personalized Insights & Recommendations
Highlights patterns and anomalies impacting performance with targeted, data-driven recommendations so teams can act with confidence.
Industry Benchmarking
Enables organizations to compare KPI performance with industry peers, providing context on where they are performing well and where improvement is needed.
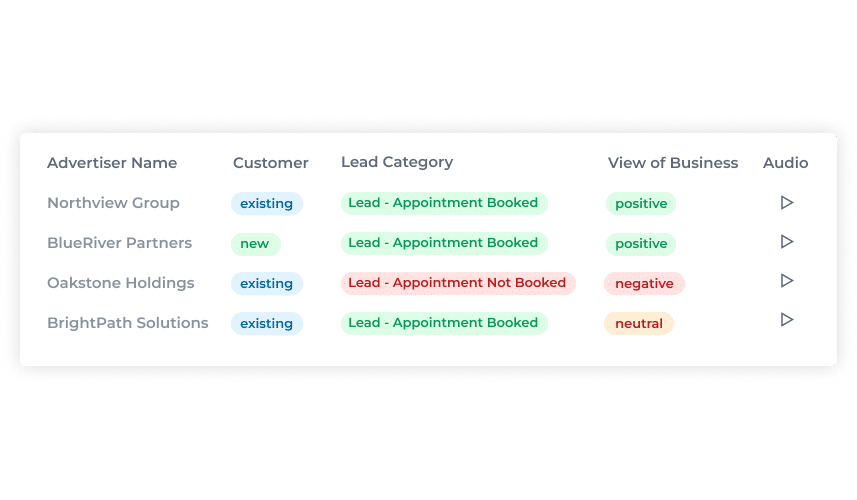
Call Log
Provides an enhanced view of individual calls with advanced filtering, so teams can quickly find specific call examples for follow up and training purposes.